

Although not over at all, the Omicron wave that hit DC starting last December is definitely in retreat. Case numbers are down 52% from the peak on January 4th. If things continue, we should be back down to pre-Omicron numbers in a matter of a few weeks.
So while the wave is not completely in the rear view mirror, it’s well enough along that we can compare how Georgetown as a neighborhood did compared with the rest of the city. And the answer is pretty well.
Here’s a chart from DCcovid.com showing how Georgetown’s two sub-neighborhoods (Georgetown and Georgetown East) did compared with all other DC neighborhoods (all the other neighborhoods are represented by the gray lines):
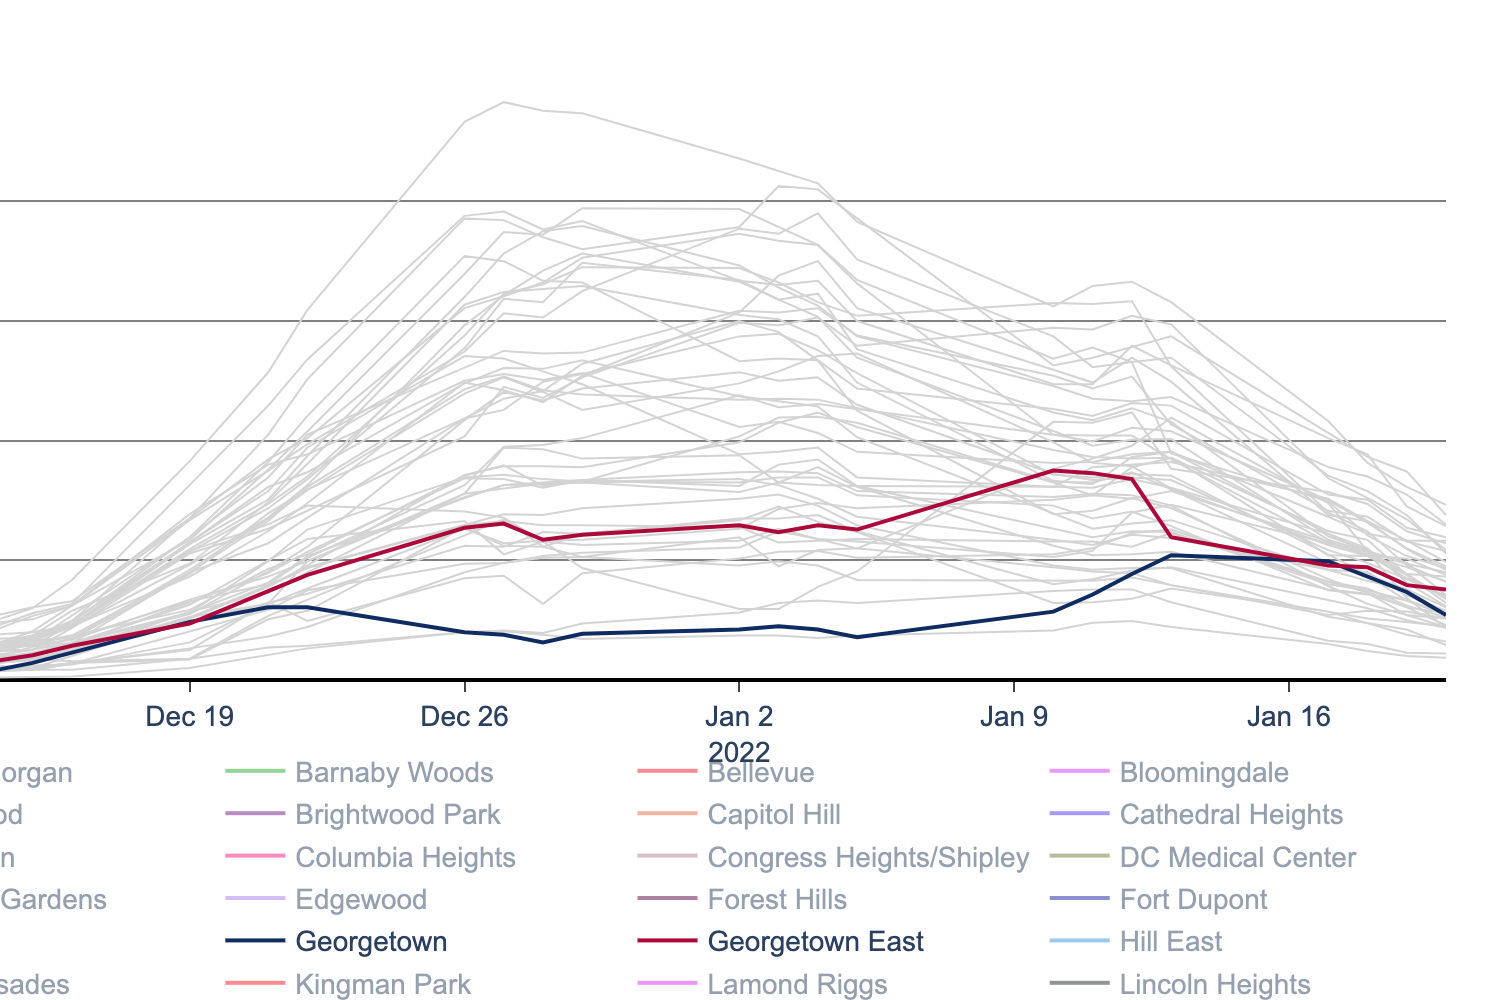
Georgetown (i.e. west Georgetown) recorded among the lowest cases of any DC neighborhood through the end of December into early January. Not surprisingly when the students returned the numbers jumped. But even then, it remained in the lower half of neighborhoods. East Georgetown (which for this purpose includes parts of west Dupont) was higher throughout, but still well below the median neighborhood.
Several factors probably contributed to this result. Georgetown has a high vaccination level and probably has relatively few residents who work in-person in a high risk environment. Moreover, anecdotally, it appears that residents have been quick to re-mask up, using higher grade masks. In either event, keep it up!


You must be logged in to post a comment.