
In GM’s article yesterday, he mentioned that the Census Bureau counted about 800 fewer people in Georgetown in 2020 versus 2010. GM speculated that much of that could be attributed to undercounting caused by the pandemic. But a look at the more granular data presents a different story.
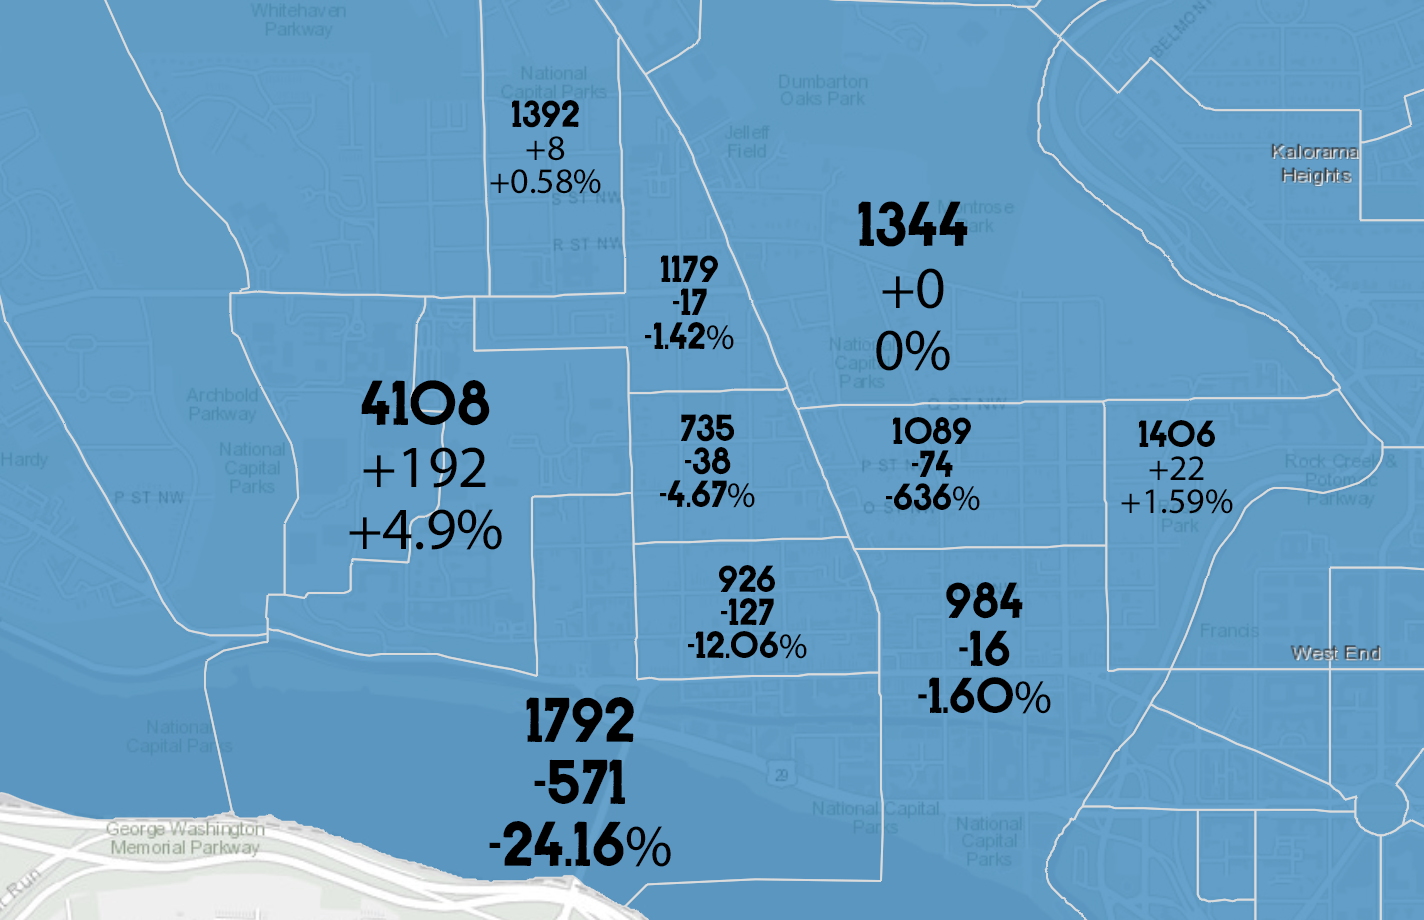
Above is a map of the Census block groups for the Georgetown area. Each block group shows the 2020 count (on top), the nominal change since 2010 (the middle), and the percentage change. As you can see, for most of Georgetown the changes were fairly minor. In east Georgetown, the upper, lower and eastern groups were basically the same. In the upper portions of west Georgetown, the numbers were also fairly flat. But the remaining groups showed some noticeable variation.
Most notably, the lower west part of Georgetown lost 571 people, over a quarter of the population. The next block group up (basically M up to O St. between Wisconsin and 35th) lost 127, over 12%. Conversely, Georgetown University gained 192, almost 5%.
What’s going on?
Much of the change appears to relate to Georgetown students. Over the 571 residents lost from lower Georgetown, 547 can be tied to drops in the blocks between 35th and 37th above Prospect. In other words, the blocks that would normally be full of Georgetown students. Although the students were likely away during the Census count last year, universities were requested to report the numbers as the would have been minus the pandemic. So the drop shouldn’t be viewed strictly as a result of the students being sent home.
It’s possible that the school simply changed how it reported the headcount for the students who would have been living on these blocks in 2020 were it not for Covid. For instance, for the block containing the LXR dorm, there was a 312 drop in the count. This would not be the first time that an apparent big change in population in these blocks was more likely attributable to an adminstrative change. In 2010, these blocks reported nearly 1,000 more residents than in 2000. But that was more down to the school changing how it handled its headcount.
Some of the decline appears genuine, to some extent. The drops in the central three block groups can’t be attributed to an administrative change by the school. It’s likely that there really were fewer people around to answer the Census. Were they at their beach house? Were they in the process of selling their home? Did they just have other things on their minds than answering the Census? Who knows. But if GM’s still doing this in ten years, he bets he be linking back to this article and writing that the drop was temporary if it was even real in the first place.


You must be logged in to post a comment.