
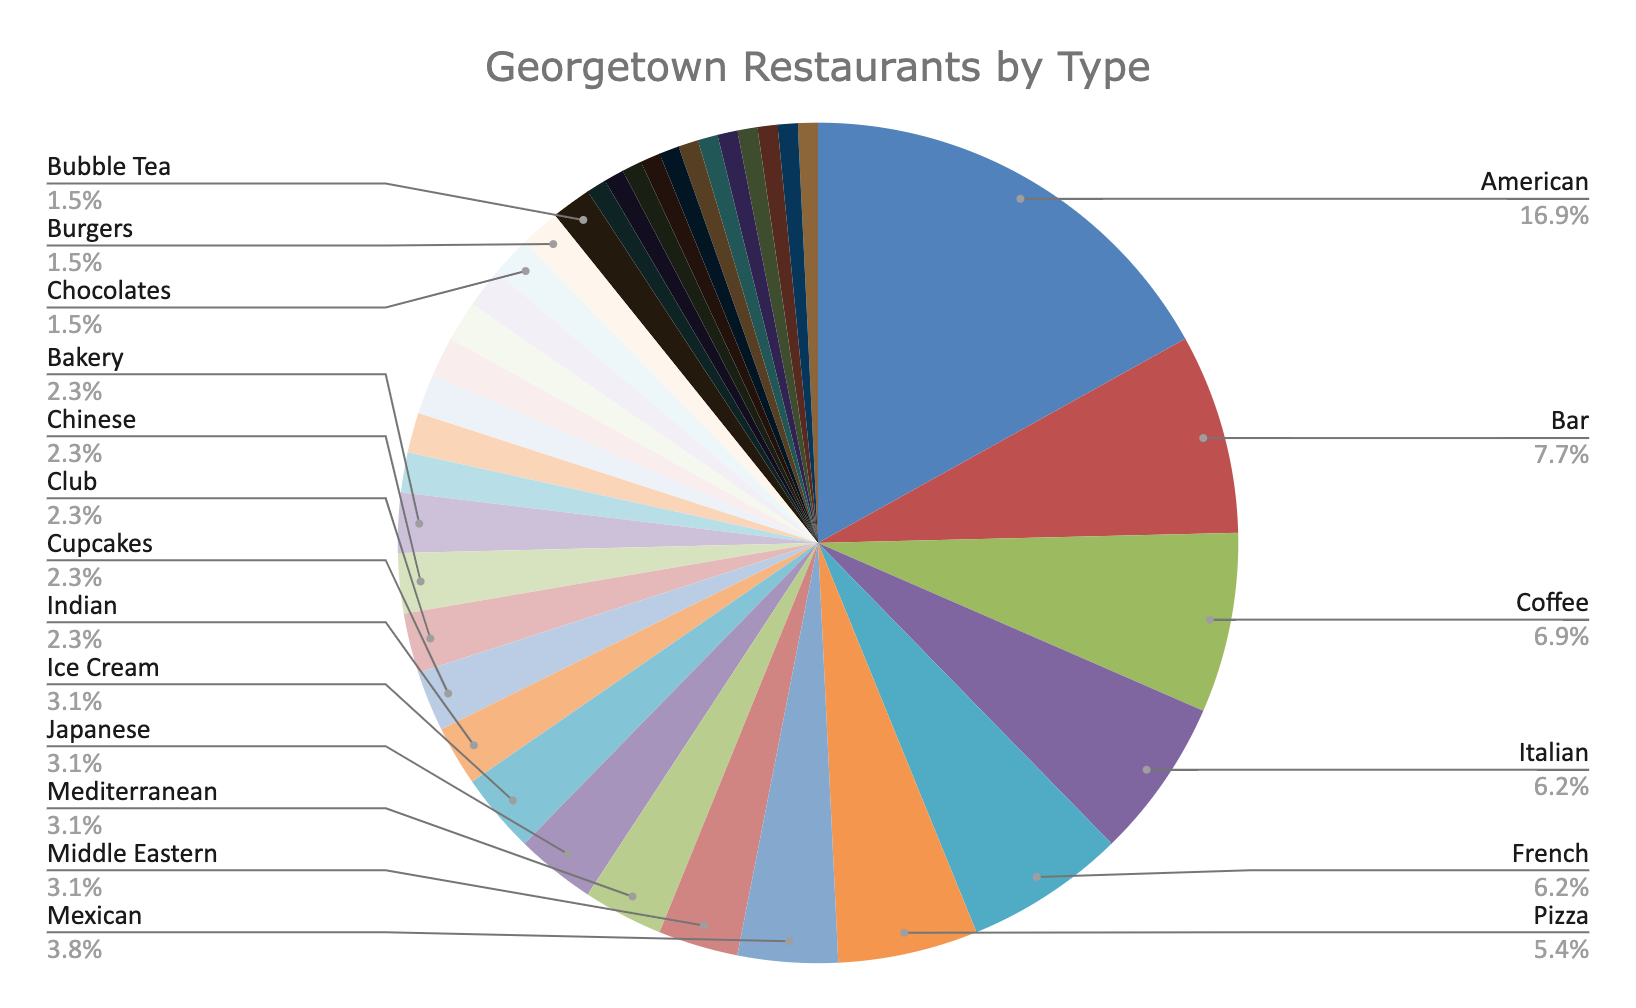
As part of GM’s store survey, he always loves to put all the restaurants and such into a pie graph and chart out what variety of cuisine the neighborhood offers. Above is this year’s chart.
As in previous years, generic American leads the way, with “bar” now coming in behind. This is partially a change in counting (GM has excluded them in previous years) and partially a reflection of the rise of fancy cocktail bars in Georgetown, with the Fountain Inn and Donahue being two recent additions.
Coffee shops still are well represented, although their numbers are down to 8 from the 12 they had before Covid hit.
Italian is the largest non-American cuisine represented, with French close behind. From there it’s a long list of different cuisines each with a handful of representatives. All in all, if you’re hungry in Georgetown, you’ve got a plethora of cuisine options.


You must be logged in to post a comment.