
In GM’s article yesterday, he mentioned that the Census Bureau counted about 800 fewer people in Georgetown in 2020 versus 2010. GM speculated that much of that could be attributed to undercounting caused by the pandemic. But a look at the more granular data presents a different story.
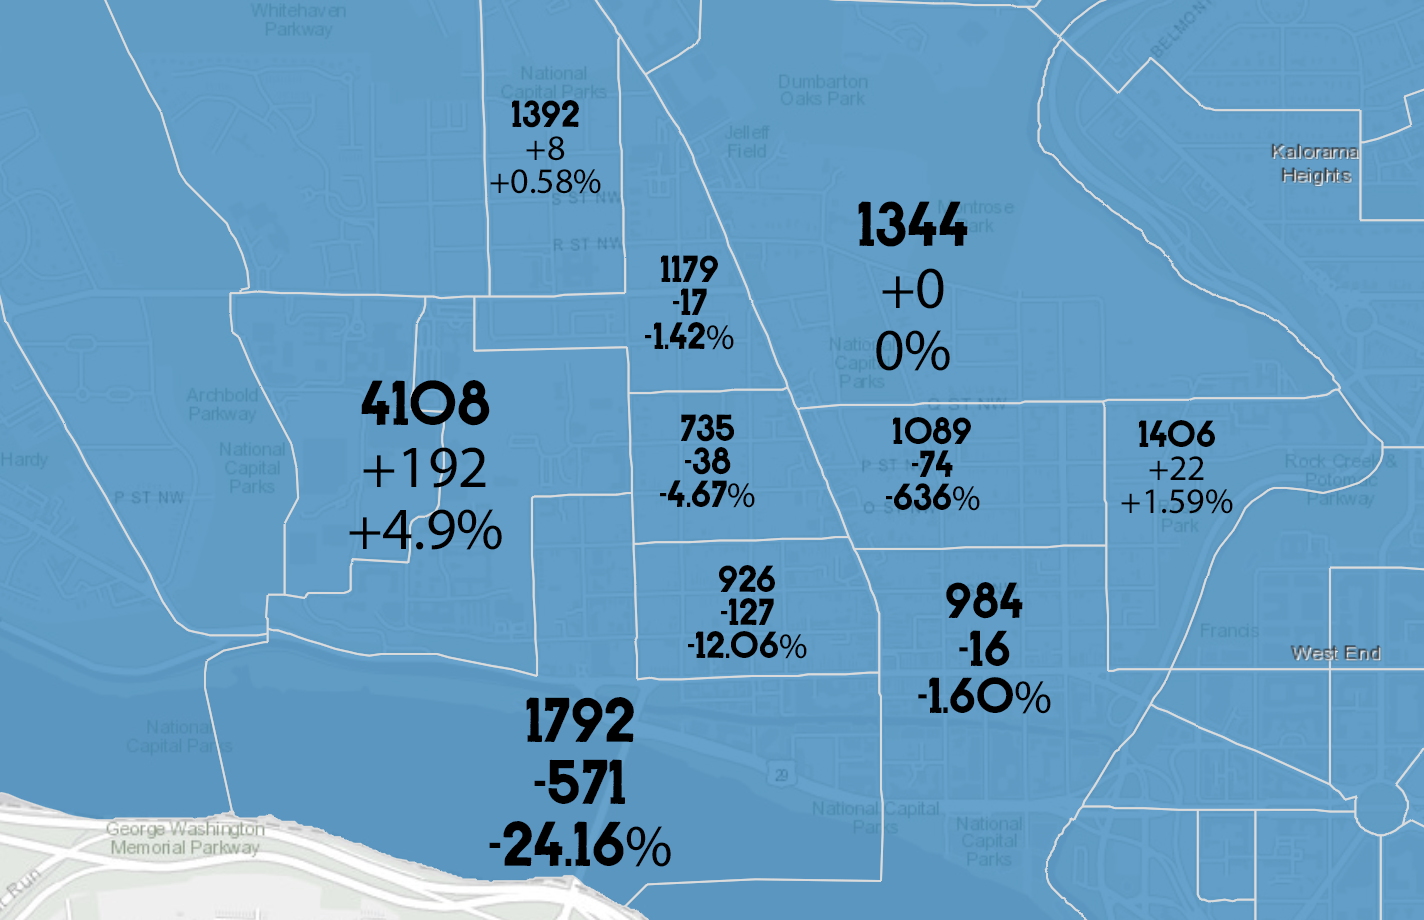
Above is a map of the Census block groups for the Georgetown area. Each block group shows the 2020 count (on top), the nominal change since 2010 (the middle), and the percentage change. As you can see, for most of Georgetown the changes were fairly minor. In east Georgetown, the upper, lower and eastern groups were basically the same. In the upper portions of west Georgetown, the numbers were also fairly flat. But the remaining groups showed some noticeable variation.
Most notably, the lower west part of Georgetown lost 571 people, over a quarter of the population. The next block group up (basically M up to O St. between Wisconsin and 35th) lost 127, over 12%. Conversely, Georgetown University gained 192, almost 5%.
Continue reading


You must be logged in to post a comment.