 Photo by theMuuj.
GM has written a bit on who lives in Georgetown and how we get around, but today he’s going to ask: how’d we get here. Well, maybe not how specifically, more like when and from where.
Here are the answers to those questions according to the American Community Survey:
When We Got Here:
According to the ACS, here’s how it breaks down as to when Georgetown residents arrived to the neighborhood (this is by household, not resident):
| Moved in 2005 or later | 38.36% |
| Moved in 2000 to 2004 | 28.32% |
| Moved in 1990 to 1999 | 18.21% |
| Moved in 1980 to 1989 | 10.73% |
| Moved in 1970 to 1979 | 1.57% |
| Moved in 1969 or earlier | 2.81% |
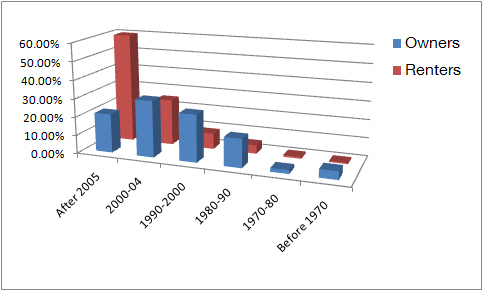
So most people got here since 2000. Unsurprisingly, owner-occupied units tend to have been occupied longer than rental units:
In case you’re interested, 56% of homes in Georgetown are owner-occupied, the other 44% are rentals. GM was surprised to see that the owner-occupied numbers on the west side are a lot higher than the east. On the west side it’s 61%, while on the east it’s only 52%. Also interesting: among rented units, the east side is more likely than rented units on the west side to have been occupied since 2005 (27% to 17%). That means there’s more frequent turnover on the east side than the west, which GM imagines is counter to conventional wisdom.
Notwithstanding all this apparent moving around, most Georgetowners (76%) lived at the same address the year before (for the District-wide that number is 81%). Of the remaining 24% of Georgetowners who moved here within the past year, 52% came from another house in the District. Of the rest, they came from the following regions:
- Northeast: 39%
- Midwest: 13%
- South: 39%
- West: 9%
Where are Georgetowners Originally From?
Ok, so that’s where Georgetowners are recently from, but where are they originally from? Well, 13% are District natives. Of the rest of the US natives, the regional origins break down like this:
- Northeast: 41%
- Midwest: 20%
- South: 27%
- West: 11%
So reading between the lines, from 2005 to 2009 Georgetown’s newest residents tended to be a lot more Southern and less Midwestern than the rest of the population. That definitely fits with GM’s observations.
As for non-natives, 15% of Georgetown’s population was born outside the U.S. (well a small group of U.S.-natives were actually born outside of the U.S. but are still considered natives, such as children of US citizens, etc.) Of those foreign born Georgetowners, about half are naturalized U.S. citizens now.
GM could go on with this all day, but this is enough for today. Hopefully by now you realize how cool the American Community Survey is.


Hey GM,
Wondering if the moved in numbers for “after 2005” include Georgetown University students?
Denis, to the extent they live off campus, yes.
As someone who was born in Georgetown, the few numbers of residents living here forty years is surprising.