Category Archives: Demographics

The Georgetown Household

The Georgetown Household

GM was looking for something to write about last night, and he realized that when he was going through the most recent American Community Survey results from the Census last January, he forgot to focus on Georgetown household stats. So let’s remedy that!

There are 4,827 households in Georgetown (this excludes GU). Of those, 4,147 are occupied and 680 are vacant. They contain 10,315 people, so the average household holds 2.49 residents.

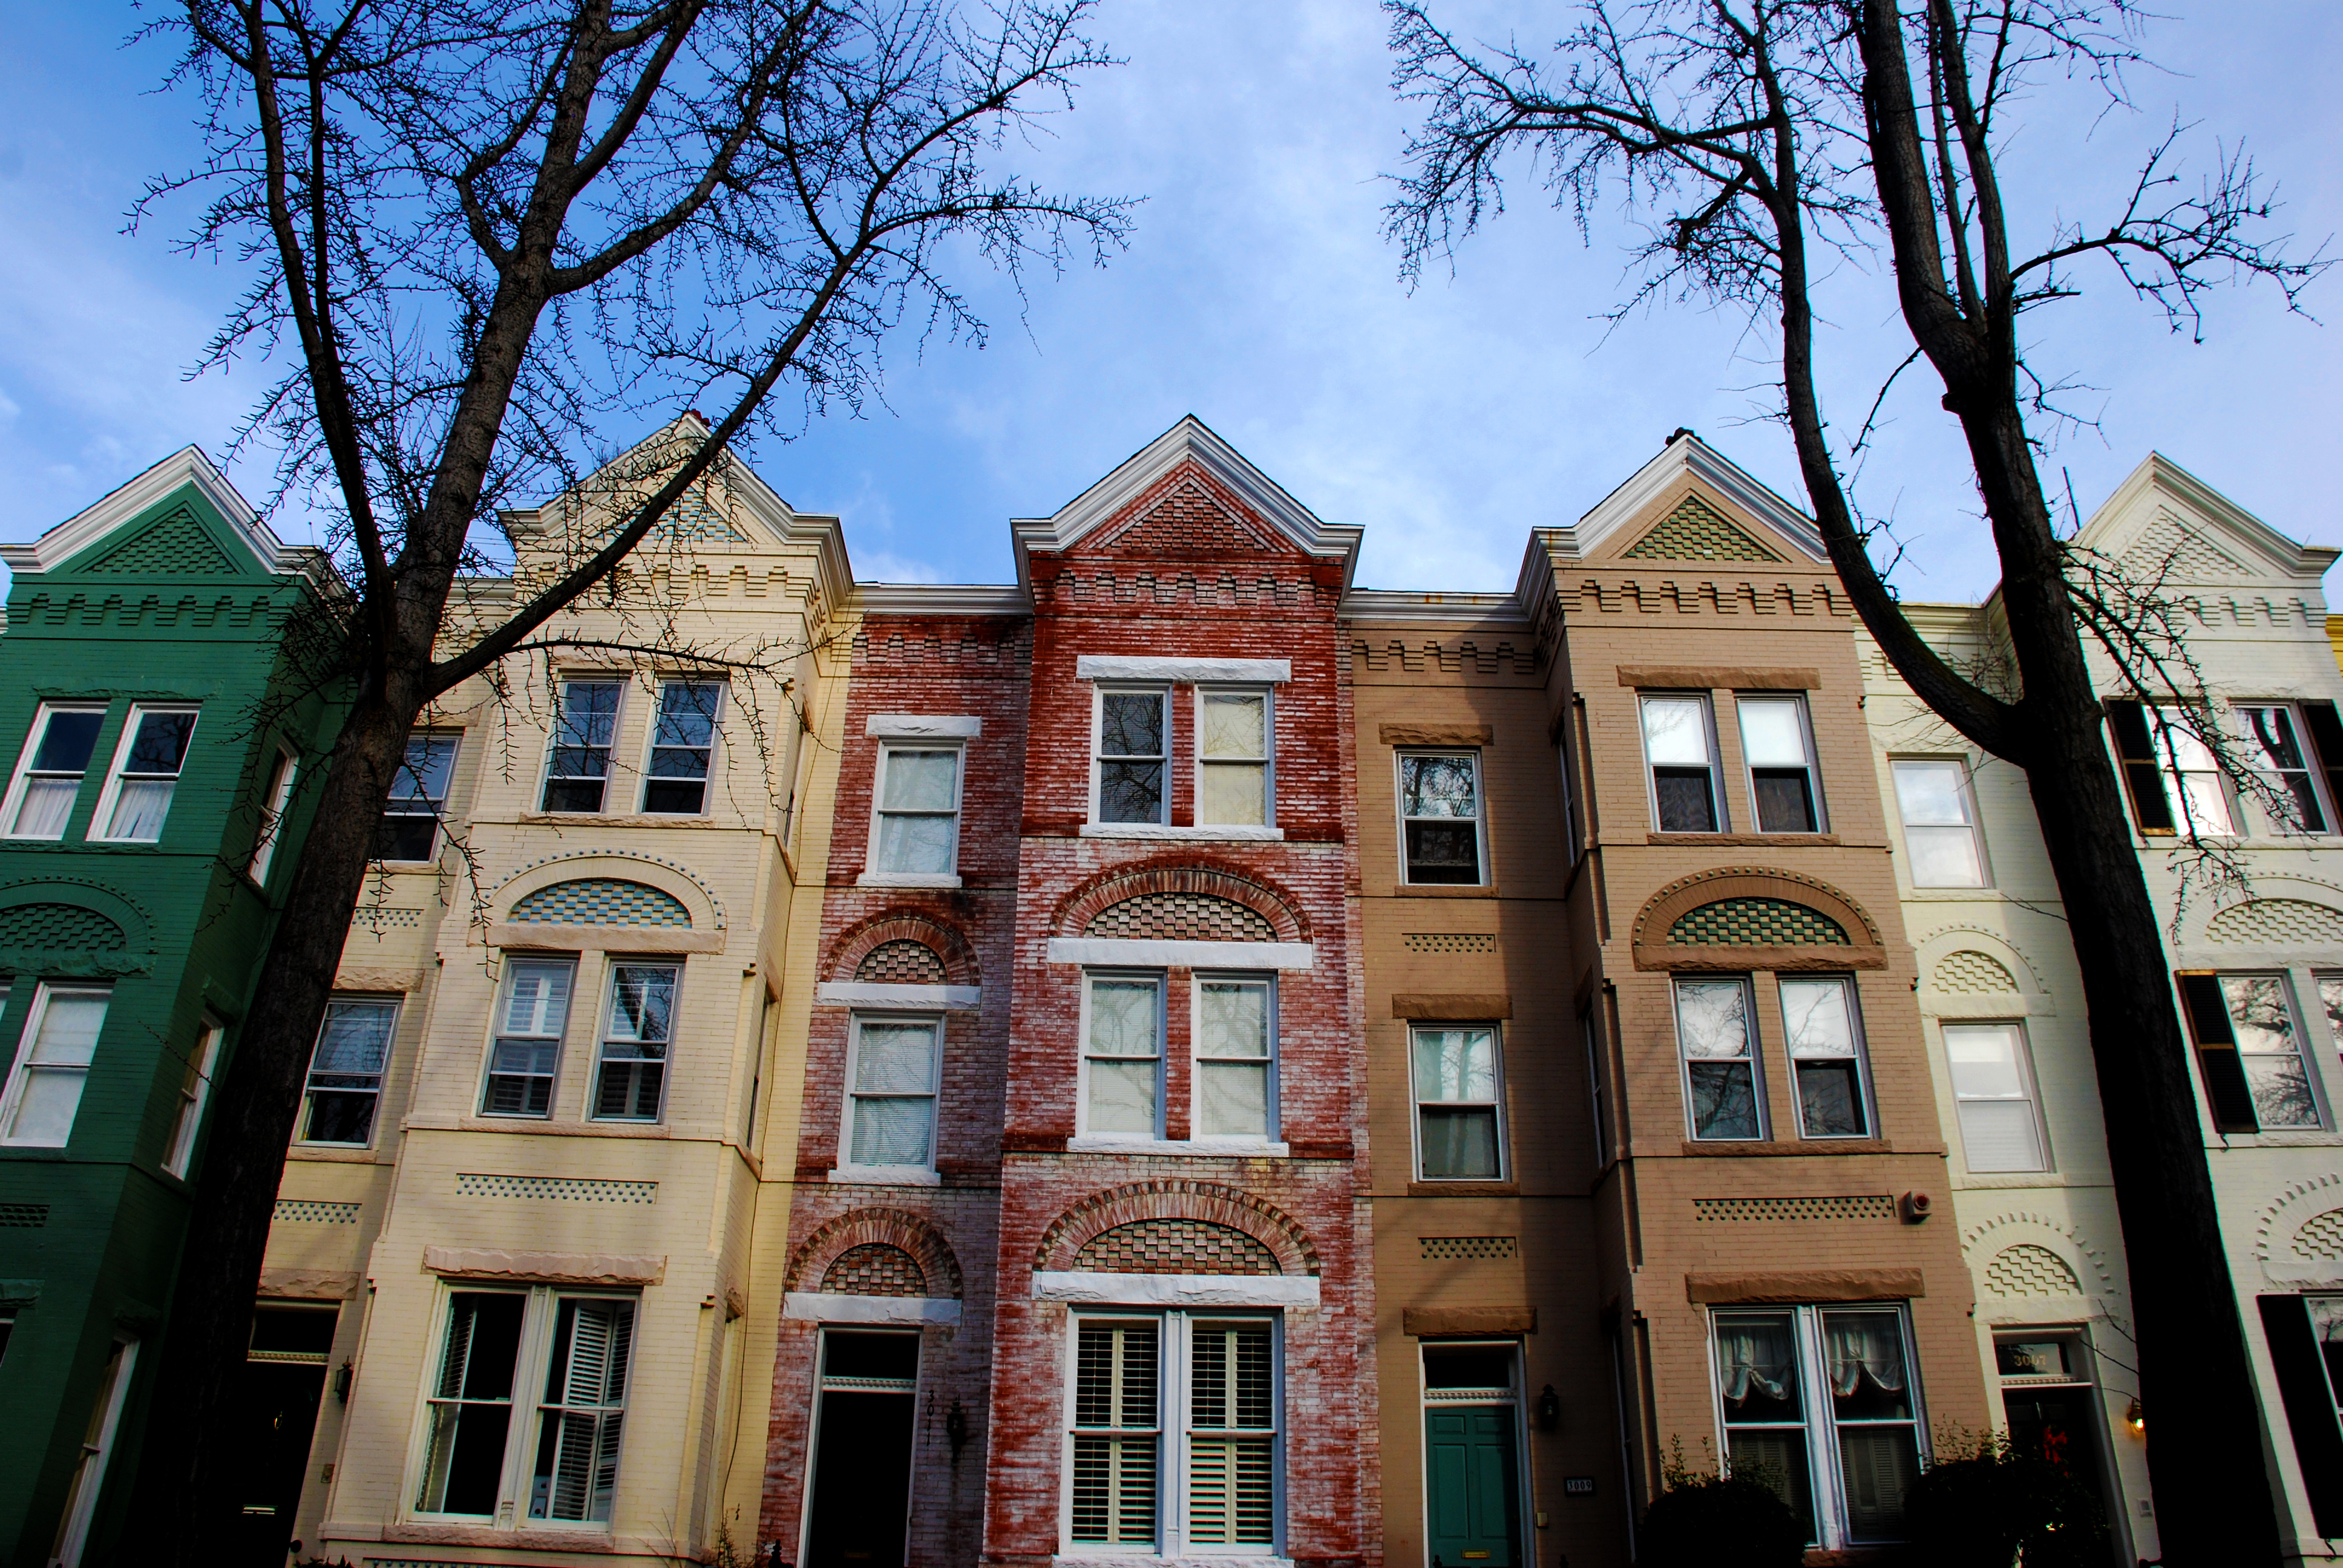
Over 65% of the housing structures were built before 1939. Unfortunately that’s the earliest category for this data, so it doesn’t say how many homes are 18th or 19th century structures. The next largest percentage of housing age is for the 1980s, when 11% of Georgetown housing structures were built. Continue reading

Advertisement

4 Comments

Filed under Demographics

Counting Georgetown: Families

DSC_0392


GM’s been going through the recent release of the American Community Survey and seeing what it has to say about Georgetowners. The other day, GM mentioned that the baby boom is continuing in Georgetown. Today he’ll explore that closer, and take a look at what the average family in Georgetown looks like.

According to the ACS, there are 4,187 households in Georgetown (that excludes the GU campus). There are 1,787 households with families in them. A family is defined to be a household with two or more people in it who are related by birth, marriage, or adoption. So it could be a married couple, a family of five, or two siblings. The average family household size in Georgetown is 2.63. Continue reading

1 Comment

Filed under Demographics

Counting Georgetown: Getting to Work

Today, GM digs back into the recently released American Community Survey results issued by the Census Bureau. Specifically, GM is going to explore one of his favorite topics: transportation.

Last year, GM reported that the numbers showed a dramatic reduction of Georgetowners driving to work and a smaller, but still significant, jump in transit use. He is somewhat sorry to say that some of those trends reversed themselves this year.

Here are the year to year comparisons:

2010

2011

Drove Total

31.43%

38.49%

     Drove Alone

28.12%

33.21%

     Carpool

3.31%

5.27%

Transit

24.46%

23.05%

Walked

25.63%

23.78%

Other

5.97%

7.61%

At Home

9.20%

7.08%

The driving totals went almost back to where they were in 2009 and the transit cohort shaved off a few percentages. “Other” is up pretty significantly, which probably reflects the growing numbers of bike commuters.

Before you jump to a conclusion that something happened in 2011 to change people’s behaviors, remember that each of these results reflects a running five year average. So when the 2011 numbers say 23.05% of Georgetowners took transit, it’s really saying that from 2007 to 2011, an average of 23.05% of Georgetowners took transit. So while shifting up a year would affect that somewhat, it’s not a “snapshot”.

The long term trends, though, are still towards transit, walking and “other” (which, on top of biking, also includes motorcycling, Segwaying, and whatever else doesn’t involve a car or public transit.) Continue reading

3 Comments

Filed under Demographics

Georgetown by the Numbers

The new American Community Survey results were released recently for the Census Bureau. They show how the population has shifted from year to year. And Georgetown’s census tracts are among them. As always, they are awfully interesting.

Before GM goes too far, it’s important to remember that the ACS has estimates that are then averaged (over five years in this case). There’s a big error rate too. But it’s good enough for our purposes!

So to lets it then:

According to the ACS, the estimate of Georgetown’s population retracted a bit last year. In 2010, the estimate was 10,315 (this excludes Georgetown’s campus). This year the estimate is 9,621. This drop is most attributable to the change in one particular demographic. In 2010, the ACD estimated there were 2,639 20 to 25 year olds in the West Village. Now it estimates 1,467. It’s unlikely there was a huge exodus of 20-somethings. For what it’s worth, the Census itself counted 2,316 20-25 year olds. Continue reading

4 Comments

Filed under Demographics

How Transient Are Washingtonians?

With a talented new quarterback and a baseball team in the major league playoffs for the first time since 1933, Washington sports are getting a lot of attention recently. But in commenting on the state of Washington sports culture, a lot of writers assert that DC is apathetic towards its team because the population is so transient. But how transient is DC?

The Census shows that in some ways the conventional wisdom is correct, but there’s not necessarily a correlation between a transient population and a lack of local fervor:

According to the Census, of DC’s population, 9.1% lived in another state the year before. How does that compare with other sports towns?:

  • DC – 9.1%
  • Boston (Suffolk County) – 5.9%
  • Philadelphia – 3.2%
  • Atlanta – 4.8%
  • Chicago – 3.2%
  • Baltimore City – 3.0%
  • New York City – 2.8%
    • Manhattan – 6.2%

So of these cities, DC is far and away the highest. However, it’s worth noting, before going on, that this is not necessarily an apples-to-apples analysis. If someone moved from Arlington to DC, that would be captured whereas if someone were to move from Buffalo to Broadway, it wouldn’t. Continue reading

1 Comment

Filed under Demographics

Census Odds and Ends

On days when GM doesn’t have any particular article idea in mind, he likes to stroll back through the census numbers to see if there aren’t a few more nuggets of information worth digging up. And today is one of those days.

Language

Surprisingly, only 81% of Georgetowners speak only English at home. Of the 19% of Georgetowners who speak another language at home, only 6% speak Spanish. Also surprising, 36% of these non-exclusively English speakers are native born US citizens. GM knows one family that would fit into this category, where the father is American, the mother European, and the child bilingual.

Income

Georgetown families are not hurting, income wise. In east Georgetown, the median family income is $224,286 and the average family income is a whopping $348,784 (the reason these numbers are so different is that a few large incomes can skew an average but not a median). In west Georgetown, the median family income is $223,036 and the average $321,055.

Not all families are wealthy though. 21% of families in east Georgetown and 6% in west Georgetown make less than $75,000. Continue reading

1 Comment

Filed under Demographics

The Census: Odds and Ends

This week GM has been going through the American Community Survey records that were released by the Census recently and seeing what it has to say about Georgetowners.

Today being the end of the week, GM will just hit some remaining odds and ends that didn’t fit in to the previous days.

First, a subject newly close to GM’s heart: fertility. According to the records, 84 Georgetown women gave birth over an average year since 2005. Of those 84 women, 23 had a bachelor’s degree and 61 had some sort of a graduate or professional degree.

Second, The median commute for Georgetowners is 20-24 minutes. There are a lucky 91 Georgetowners that have a commute of less than 5 minutes. On the other end, 32 unlucky Georgetowners have a commute over 90 minutes.

Finally, only 81% of Georgetowners speak only English at home. About 6% speak Spanish at home. About 10% speak some “other Indo-European” language at home. And about 2% speak an Asian language at home.

Leave a comment

Filed under Demographics

Hitting the Books

Photo by Alamosbasement.

This week GM is strolling through the recently released Census data finding interesting tidbits about Georgetowners. Today he takes us back to school.

Here’s what grade level Georgetown’s students are at:

  • Nursery/Pre-school – 198
  • Kindergarten – 26
  • Grades 1-4 – 95
  • Grades 5-8 – 191
  • High School – 78
  • College – 1713 (note that GM is not including Census Tract 2.01, which is the GU campus, so these numbers include just off campus students) Continue reading

Leave a comment

Filed under Demographics

Where Georgetowners Came From

This week, GM is exploring the most recent Census data which reveals fascinating data about the who, what, where, and how about us.

Today, GM’s looking at the question of where we all came from.

First of all, a good number of Georgetowners came from here. Well, DC at least. Twelve percent of to be exact. Of all Georgetowners, 82% are U.S. born. So 69% were born outside of the District.

Of the Non-District born US-natives, the regional origin breakdown goes like this:

  • Northeast – 41%
  • Midwest – 21%
  • South – 28%
  • West – 10%

As a New Englander himself, GM’s glad to see that his fellow Northeasterners are still so dominant.

Of the 18% of Georgetowners who are foreign born 41% are naturalized American citizens. Continue reading

3 Comments

Filed under Demographics

The Georgetown Household

This week, GM is going through the recently released 2010 American Community Survey data from the Census. Today he’s exploring the Georgetown household.

A household, in Census parlance, is a single living unit. It can be a studio apartment all the way up to Evermay. And the ACS uses survey data to generate stats on what the average household in Georgetown looked like over the past five years. Here are the interesting bits:

There are 4,881 households in Georgetown. Of those, 89% are occupied, and 11% are vacant.

Of all the households, 6.74% are single family detached homes. A full 49% are single family attached homes (i.e. a rowhouse). Four percent are part of a structure with two units, and 3% are part of a structure with three to four units. Thirty percent of households are part of apartment buildings with 20 or more units.

It’s not a surprise that 63% of Georgetown households were built before 1939 (in fact the only surprise is that it’s not higher). A few percentage of Georgetown homes were built in each decade since then, with the exception of the 1980s, when 11% of Georgetown homes were built. Continue reading

5 Comments

Filed under Demographics